Monitor Your Plex Server Like a Pro
Never have to wonder what’s going on with your Plex server again.
Thanks to Plex for inviting me to Plex Pro Week 2025 and for sponsoring the video!
Plex Monitoring Stack – Prometheus + Grafana
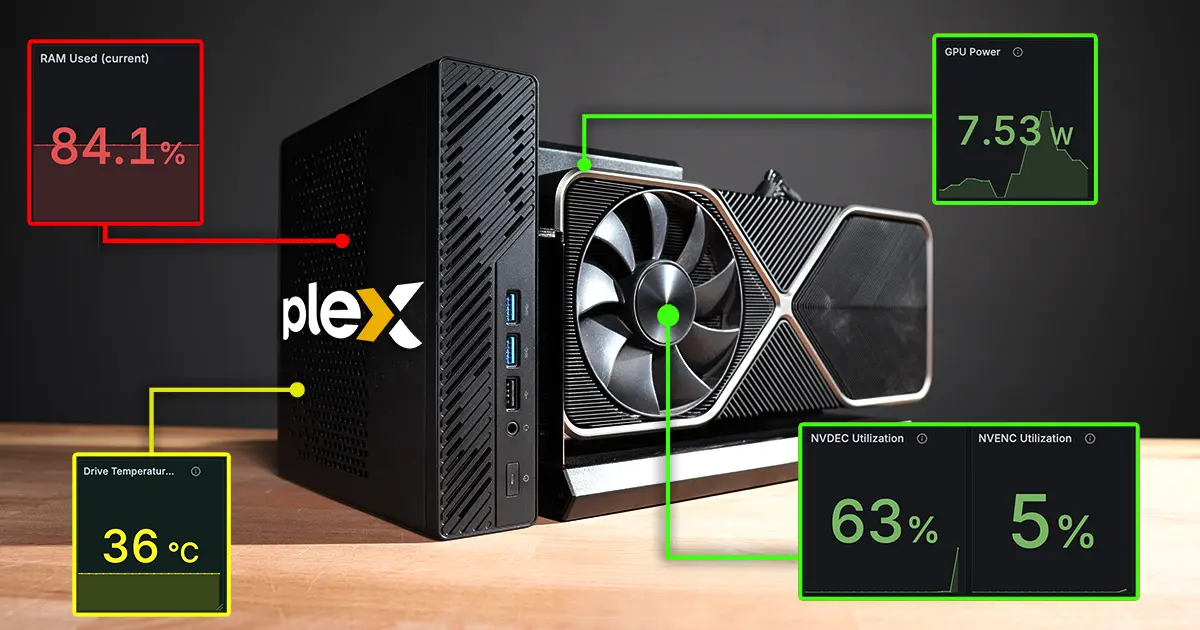
This stack provides monitoring for a Plex media server using Prometheus, Grafana, and a set of exporters. It covers system metrics, GPU usage, disk health, container stats, and Plex activity.
All configuration files, Docker Compose setup, and dashboards for this monitoring stack are available in the plex-monitoring-stack GitHub repository. You’ll find everything you need to get started, including environment file examples, provisioning scripts, and pre-built Grafana dashboards.
A big thanks to the original prometheus-plex-exporter by jsclayton — I forked and adapted it as part of this stack.
Stack Components
- Plex – Media server
- Prometheus – Metrics collection/storage
- Grafana – Visualization/dashboards
- Dozzle – Container log viewer
- node_exporter – CPU, memory, filesystem, network
- dcgm-exporter – NVIDIA GPU stats (AMD:
rocm-device-metrics-exporter) - smartctl-exporter – Disk health / SMART metrics
- cAdvisor – Container-level metrics
- plex-prometheus-exporter – Plex sessions, streams, metrics, library
Note: If you also need to monitor Windows machines, install the windows_exporter on those hosts and add them as Prometheus scrape targets.
Prerequisites
- Docker + Docker Compose
- Plex URL + Plex Token
- NVIDIA GPU with drivers and NVIDIA Container Toolkit installed (required for GPU monitoring with
dcgm-exporterand for hardware transcoding in Plex)
Setup
Clone repo
1
2
git clone https://github.com/timothystewart6/plex-monitoring-stack
cd plex-monitoring-stack
Copy environment files
1
2
3
cp plex/.env.example plex/.env
cp prometheus/.env.example prometheus/.env
cp grafana/.env.example grafana/.env
Edit values for
PLEX_URL,PLEX_TOKEN, and media paths.Set environment variables
1
2
export MEDIA_PATH="/path/to/media"
export MEDIA_SERVER_PATH="/path/to/this/repo"
Create data directories
1
mkdir -p prometheus/data grafana/data plex/config dozzle/data
Fix permissions
1
sudo chown -R $(id -u):$(id -g) prometheus/data grafana/data
Start stack
1
docker compose up -d
Access
- Plex → http://localhost:32400/web
- Grafana → http://localhost:3000
- Prometheus → http://localhost:9090
- Dozzle → http://localhost:8080
Dashboards
Preconfigured Grafana dashboards are included:
- System metrics (CPU, memory, GPU, temps)
- Disk health (SMART data)
- Plex activity (sessions, streams, transcodes)
- Container metrics (CPU, memory, network, restarts)
Troubleshooting
- Metrics missing → check exporter
/metricsendpoint - GPU blank → verify NVIDIA drivers + NVIDIA Container Toolkit are installed
- SMART blank → run
smartctl-exporterin privileged mode - Plex data empty → confirm
PLEX_URLandPLEX_TOKEN
Using Grafana
After the stack is running, open Grafana in your browser:
1
http://localhost:3000
- Default username:
admin - Default password:
admin(you will be asked to change this on first login)
Grafana in this stack comes with pre-provisioned dashboards and datasources. Once logged in, click Dashboards → Browse to see all available panels.
Included Dashboards
- Media Server Dashboard – Full stack Plex Media Server Monitoring
- Plex Dashboard – Active sessions, transcodes, library stats
- Server Dashboard – CPU, memory, disk I/O, temps
- GPU Dashboard – Encoder/decoder usage, temps, power draw
- SMART / Disk Health – Per-drive health and temperature
- Container Dashboard – Plex and other container usage (CPU, memory, bandwidth)
You can access dashboards by:
- Opening the left-hand menu in Grafana.
- Selecting Dashboards → Browse.
- Choosing from the list of imported dashboards.
You can also use the search bar at the top of Grafana to quickly find dashboards by name.
Join the conversation
Ever wonder why @plex buffers even when your server looks fine?
— Techno Tim (@TechnoTimLive) September 22, 2025
I built the Ultimate Plex Dashboard with Prometheus + Grafana to track CPU, GPU, disks, streams & more - all in one place.
👉https://t.co/V1cHwjfDT1 pic.twitter.com/gpGU8uezdI
This setup provides a single dashboard with system, Plex, and container monitoring in one place. Open Grafana, pick a dashboard, and start exploring your metrics.
Links
🛍️ Check out the new Merch Shop at https://l.technotim.live/shop
⚙️ See all the hardware I recommend at https://l.technotim.live/gear
🚀 Don’t forget to check out the 🚀Launchpad repo with all of the quick start source files
🤝 Support me and help keep this site ad-free!